Embark on an enlightening exploration of the intricate journey of data, tracing its lifecycle from inception to its myriad destinations. “Data Tracks” offers participants a captivating guided tour through the various stages of data, providing invaluable insights into its creation, dissemination, and utilization.

Through engaging group discussions and interactive activities, participants will delve into the fascinating world of data, sharing personal experiences and perspectives. From the moment data is generated to its ultimate destinations, participants will gain a comprehensive understanding of the pathways and processes involved in its lifecycle.

One of the workshop’s highlights is the in-depth analysis of where data travels after its creation. Participants will explore the intricate data flow network, uncovering the diverse channels through which data is transmitted, stored, and accessed. From online transactions to social media interactions, participants will gain a nuanced understanding of the digital ecosystem and the various actors involved in shaping the destiny of data.

By the end of the workshop, participants will emerge with a heightened awareness of their digital footprint and the tools they need to navigate the digital landscape confidently. Whether you’re a novice seeking to understand the basics of data privacy or a seasoned internet user looking to enhance your cybersecurity practices, “Data Tracks” offers something for everyone.

Join us on this transformative journey as we unravel the mysteries of data and empower participants to cultivate a secure and informed online presence. Your journey to digital empowerment begins here.

Resources we will be using include:

NYC Open Data (https://data.cityofnewyork.us/browse): Participants will use this resource to create a visual timeline of a typical day, highlighting where and how data is generated and collected. They can explore datasets related to various aspects of daily life in New York City, such as transportation, weather, social media usage, and public services, to visualize the flow of data throughout their day.

NYS Cybersecurity Tips (https://its.ny.gov/cybersecurity-tips-topics): Participants will learn about best practices for safeguarding personal information online, including tips for creating strong passwords, enabling two-factor authentication, avoiding phishing scams, and using encryption tools. They’ll explore resources provided by NYC’s cybersecurity initiatives to enhance their awareness of online privacy and security measures. This includes exploring scenarios of data breaches and their impact and discussing the importance of protecting sensitive information from unauthorized access and misuse. Finally, they will engage in a discussion on responsible data-sharing practices and the tools and resources available for protecting and managing data. They’ll leave with privacy, transparency, and accountability in data sharing and management processes.

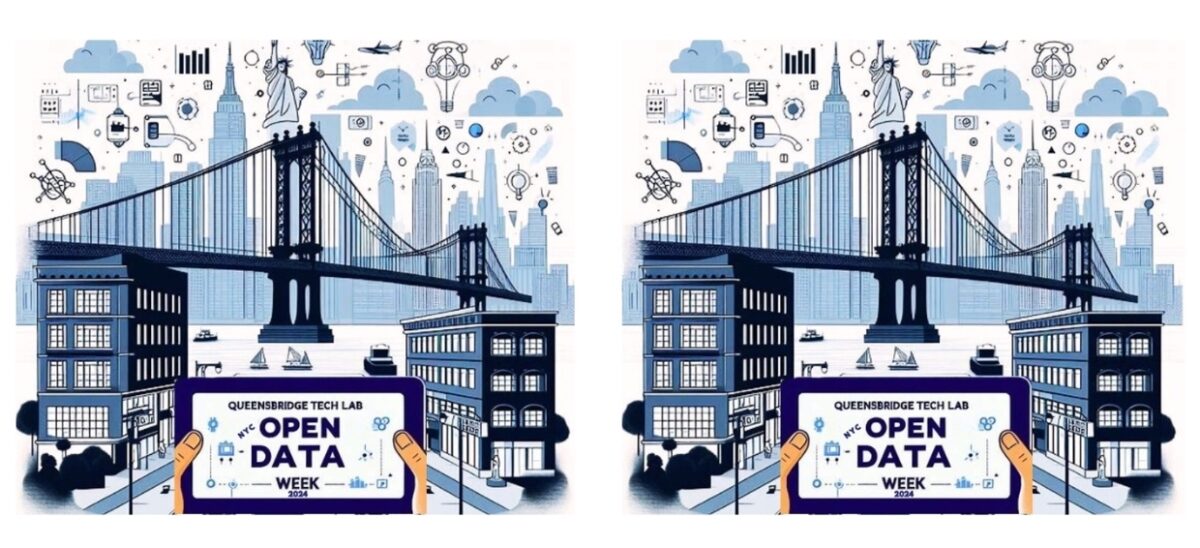
In this comprehensive workshop, participants will embark on an enlightening journey into the world of data and its transformative influence across diverse industries. Attendees will delve into the dynamic intersection of data and decision-making, gaining invaluable insights into its practical applications.

Throughout the workshop, participants can utilize cutting-edge data visualization tools in hands-on exercises, witnessing firsthand the power of data visualization in conveying complex information clearly and compellingly.

One of the workshop’s key highlights is exploring how data permeates and revolutionizes various sectors, including education, healthcare, and business. Participants will better understand how data-driven approaches reshape these industries, leading to more informed decision-making processes and improved outcomes.

Moreover, the workshop will provide a comprehensive overview of the myriad career paths in data analytics and data science. From data analysts to data scientists, participants will discover exciting opportunities to leverage their skills and passion for data to shape the future of their careers.

Resources we will be using:

NYC Open Data:  (https://data.cityofnewyork.us/browse) This portal provides access to a diverse range of datasets from various sectors within New York City. It offers a valuable resource for exploring real-world examples of data-driven decision-making across industries. Class participants can utilize this portal to access datasets relevant to their interests and explore practical applications of data analysis and visualization within an urban context.

Cognitive AI: (https://cognitiveclass.ai/learn/data-science): This offers a comprehensive training provides a valuable resource for class participants who are seeking to learn more about data-driven career paths and opportunities. Utilizing information on data science principles, methodologies, and tools helps prepare them to uncover insights, understand industry needs, and explore potential career paths in the dynamic field of data science.

In an era of information, navigating the complexities of data has become an essential skill for individuals across various fields. “Cracking the Code” comprehensively explores data and its significance in our contemporary society. It aims to demystify its intricacies and empower participants with the knowledge to make informed decisions in today’s data-driven world.

This class is a foundational guide to understanding the fundamentals of data and its pervasive influence on our daily lives. Participants will embark on a journey of discovery, gaining insights into the diverse forms of data that permeate our modern world, ranging from numerical datasets to textual information.

Throughout the course, participants will delve into the significance of data across various contexts, exploring its role in shaping everything from consumer behavior to public policy. By unraveling the complexities of data, participants will develop a deeper appreciation for its ubiquitous presence and transformative potential in today’s society.

Moreover, “Cracking the Code” goes beyond mere theory to provide practical insights into how data can effectively inform decision-making processes and drive meaningful outcomes. Through interactive exercises and real-world examples, participants will learn how to analyze and interpret data, equipping them with the tools to extract valuable insights and draw informed conclusions.

Whether you’re a novice seeking to understand the basics of data or a seasoned professional looking to enhance your data literacy skills, “Cracking the Code” offers something for everyone. Join us on this enlightening journey as we unravel the mysteries of data and discover its profound impact on our interconnected world.

The resources we will be using include:

NYC Open Data (https://data.cityofnewyork.us/browse): This resource provides datasets related to demographics, transportation, and public services in New York City. Participants can explore real-world examples of data in everyday life and discuss its importance in decision-making, business operations, scientific research, and societal impact. They can further analyze transportation data to understand commuter patterns or explore demographic data to identify population trends.

NYS Health – Data and Statistics (https://www.health.ny.gov/statistics/): This resource offers health-related datasets that illustrate dataset characteristics and variables. Participants can define datasets, discuss their characteristics, and explore variables, including independent and dependent variables. Participants can also examine health outcome data to identify variables such as patient demographics, treatment methods, and health outcomes.

NYC Crime Map (https://maps.nyc.gov/crime/): This resource offers crime data for New York City, allowing participants to distinguish between qualitative and quantitative aspects of data. They can explore examples of both types of data within crime statistics, such as qualitative descriptions of crime incidents and quantitative data on crime rates, locations, and trends.

NYC Environment and Health Data Portal (https://a816-dohbesp.nyc.gov/IndicatorPublic/data-explorer/): This resource offers environmental datasets for New York City, providing examples for discussing the choice between qualitative and quantitative approaches in data analysis. Participants can explore environmental data to classify examples into qualitative and quantitative categories and discuss when each approach is appropriate in different scenarios, such as assessing air quality or water pollution levels.

Eighteen years ago, New York City released CityMap to the public. Brimming with dozens of spatial data layers and locational search capabilities, CityMap connected the public to data in an unprecedented way. Recently, the agency hosting the application decided it was time to retire the legacy version and release something new. In August 2023, a survey of users was conducted that garnered 1500 responses that provided insight into the CityMap users and how they used the app. In this presentation, Tim Calabrese from Esri’s Professional Services team based in New York will outline CityMap’s history, explore the user feedback in detail and identify gaps between the feedback and the current version.

The goal of the session it to foster ideas for new public mapping applications based on Open Data. Along the way, we’ll use CityMap as a case study for exploring the roles of the government, private sector, civic tech and the public in the development and maintenance of apps the make Open Data more usable. If you’ve ever used CityMap, join us and weigh in on your likes, dislikes and ideas for improvement.

Dive into the heart of NYC’s immigration trends with us! This session is led by Carman Nareau and Justino Mora on Emerson Collective’s Technology team. Ideal for students, academics, policymakers, and data enthusiasts, this presentation focuses on the ethical usage of immigration data and its societal impact.

In this session, we will explore:

  • NYC’s immigration stats as told by analysis of data of the Executive Office of Immigration Review (EOIR), a publicly available data set that’s notoriously hard to understand but unparalleled in its insights
  • Considerations when using immigration data, including privacy, quality, and the potential harmful impact on immigrant communities if mishandled
  • Custom data visualizations and use cases of responsible data handling,

Join us to gain a deeper understanding of NYC’s immigration landscape and how we can ethically use data to move forward together. We’re excited to see you!

Presenters ⭐️

Kiley Matschke (Post-Baccalaureate Fellow at Barnard College’s CSC),

Marko Krkeljas (Senior Software & Applications Developer and CSC Technical Manager at Barnard College)

Event details 📊

Join us in celebrating NYC Open Data Week at Barnard College’s Vagelos Computational Science Center (CSC)! This two-part workshop and data jam will explore data analysis and visualization utilizing NYC environmental data. In the first half of this workshop, participants will explore ChatGPT’s data capabilities and contrast them with their own analyses via Google Co-lab. In the second half, participants will work in small groups to ideate and produce creative, accessible projects that showcase their data findings (i.e., in the form of collages, songs, stories, etc.). This workshop will explore the importance of data presentations and their impact on viewer perceptions. Those from all backgrounds and coding levels are welcome, beginner-friendly. Register here!

Location 📍

This will be a hybrid event!

Important note: Attendees who are not affiliated with Barnard College or Columbia University are strongly encouraged to attend this event via Zoom. This is due to increasingly strict/fluctuating policies surrounding campus access for the general public.

In-person location: Barnard College, Milstein Center Room 516 (5th Floor); 3009 Broadway, New York, NY 10027

Online location: Zoom (Register here to receive the link, which will be emailed in advance of the event)

The Bronx River Alliance uses, collects, and analyzes data from countless sources to advocate for and improve the condition of the Bronx River and the communities that surround it. Join us to see how data has brought an urban river corridor back to life, and discuss ways in which environmental data accessibility can be improved to further environmental restoration and protection goals across the city and beyond.

We’ll kick off the event with a short presentation about the Bronx River Alliance – including the work we do and the challenges we face in collecting, organizing, and sharing data. Afterwards, we will open the floor for a collaborative brainstorming discussion about community data collection, especially around water quality and the overall environment of New York City, and have some time for attendees to chat with each other.

The last hour of the event will consist of an optional walking tour (handicap accessible) of Starlight Park and the Bronx River House

If you have shareable ecological data – whether you collect water samples, are an avid recorder of bird migrations, or work in a laboratory for soil analysis – please come prepared to discuss or even bring a sample!

Email christian.murphy[at]bronxriver.org with any questions.

Are you interested in enriching your reports and manuscripts with interactive content? Join Donnise Hurley from the NYC Department of City Planning to gain a basic knowledge of how to create dynamic, reproducible documents in R. Participants will receive an introduction to Markdown basics; using YAML metadata and CSS to control how files are rendered; simple syntax for adding interactive content such as maps; formatting text; and adding quotes, footnotes, and references.

Join us for an insightful exploration & discussion of the Cure Violence program! During this session, attendees will gain insights into the CURE Violence program and listen to discussions on program evaluation, data utilization, and recommendations. This event is for policymakers, community leaders, researchers, and anyone passionate about fostering safer, healthier communities.

Cure Violence uses a public health approach to reduce gun violence. It aims to prevent conflicts from escalating, support individuals at high risk of violence, and shift social norms. You will briefly hear more about Cure and its history, and the results of our analysis of its effectiveness. This will set the stage for a panel discussion featuring stakeholders invested in building safer communities in NYC.

Panelists include Jeffrey A. Butts, Director of the Research and Evaluation Center at John Jay College of Criminal Justice, Council members Althea Stevens and Yusef Salaam, Chairs of the Committee on Children and Youth and Public Safety respectively, R. Brent Decker, Chief Program Officer of Cure Violence Global, and Hector Cuevas, Vice President of Education & Youth Development programs at CAMBA and moderated by Rose Martinez, Assistant Deputy Director of the NYC Council’s Data Team.

Is the New York City Public Schools the most segregated school district in the nation, as is often claimed? What county has the most segregated schools in the United States? By how much has segregation changed after recent school integration initiatives? IntegrateUSA is a new website — launching at the NYC Open Data Week 2024 — designed to answer these and other questions. Incorporating over two decades of publicly-available school enrollment data from the National Center for Education Statistics’ Common Core of Data, IntegrateUSA can be used to easily visualize student demographics and track school segregation in all states, counties, and districts in the United States.

At this event, we (Jesse Margolis and Theo Kaufman) will discuss the motivation for IntegrateUSA’s development, demonstrate its use, and talk about the process for building it. We will outline the three key steps in our process: 1) data cleaning and calculation (using R), 2) backend database hosting (using Django and PostgreSQL) on an AWS server and 3) frontend deployment using Next.js and React. We will compare the development of this national tool with its predecessor, IntegrateNY — deployed in Tableau Public — and discuss the pros and cons of each approach.

We hope this event will be of interest to researchers, policy makers, and reporters studying school segregation as well as analysts and programmers who build tools to better visualize publicly-available data. As an initial beta release, IntegrateUSA has much room for improvement and we hope our audience will suggest both what to improve and how to make these improvements. We are grateful to the Carnegie Corporation of New York for supporting the development of IntegrateUSA.