Join Loisaida for a presentation on soil health and tree-bed conditions, followed by a field exercise examining and mapping the state of nearby street tree environments. Learn about common tree care issues, along with actions that New Yorkers and community groups can take to improve publicly available data. Our goal is to foster stewardship while maintaining and expanding the urban forest in the Loisaida neighborhood.

This event is part of Loisaida’s ECOLIBRIUM program, learn more at ecolibrium.nyc.

In an era of information, navigating the complexities of data has become an essential skill for individuals across various fields. “Cracking the Code” comprehensively explores data and its significance in our contemporary society. It aims to demystify its intricacies and empower participants with the knowledge to make informed decisions in today’s data-driven world.

This class is a foundational guide to understanding the fundamentals of data and its pervasive influence on our daily lives. Participants will embark on a journey of discovery, gaining insights into the diverse forms of data that permeate our modern world, ranging from numerical datasets to textual information.

Throughout the course, participants will delve into the significance of data across various contexts, exploring its role in shaping everything from consumer behavior to public policy. By unraveling the complexities of data, participants will develop a deeper appreciation for its ubiquitous presence and transformative potential in today’s society.

Moreover, “Cracking the Code” goes beyond mere theory to provide practical insights into how data can effectively inform decision-making processes and drive meaningful outcomes. Through interactive exercises and real-world examples, participants will learn how to analyze and interpret data, equipping them with the tools to extract valuable insights and draw informed conclusions.

Whether you’re a novice seeking to understand the basics of data or a seasoned professional looking to enhance your data literacy skills, “Cracking the Code” offers something for everyone. Join us on this enlightening journey as we unravel the mysteries of data and discover its profound impact on our interconnected world.

The resources we will be using include:

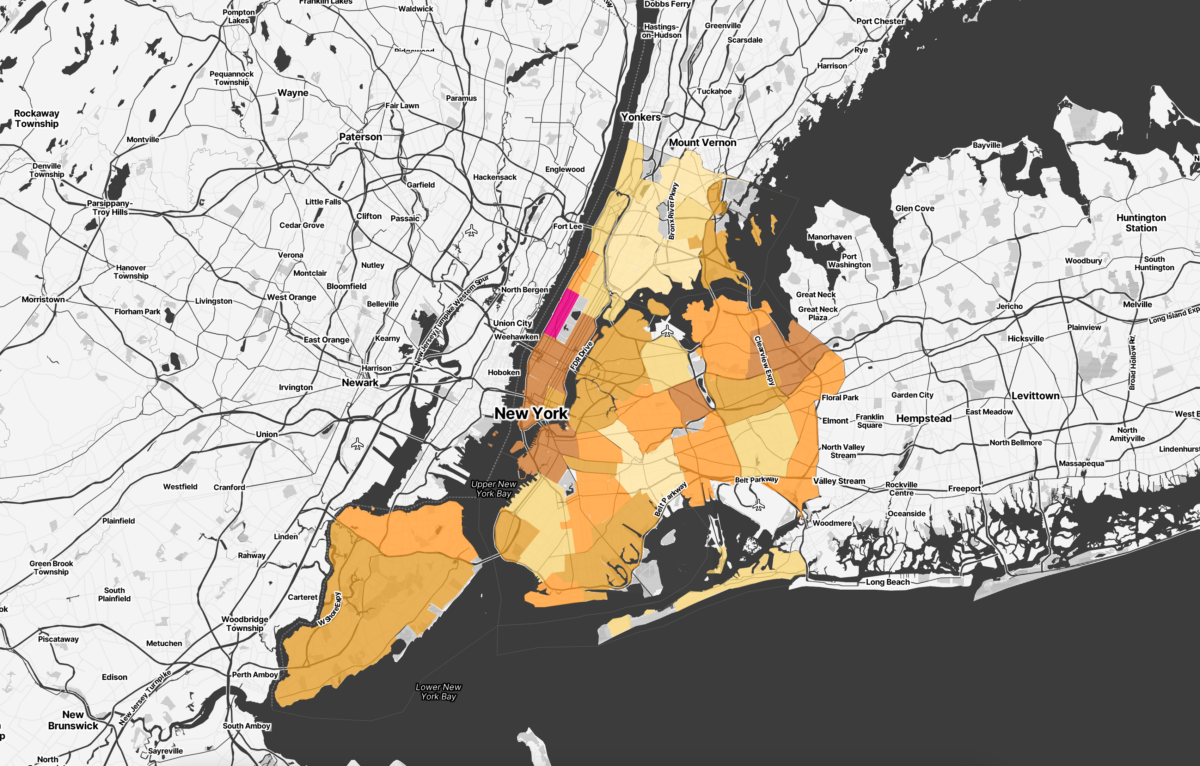
NYC Open Data (https://data.cityofnewyork.us/browse): This resource provides datasets related to demographics, transportation, and public services in New York City. Participants can explore real-world examples of data in everyday life and discuss its importance in decision-making, business operations, scientific research, and societal impact. They can further analyze transportation data to understand commuter patterns or explore demographic data to identify population trends.

NYS Health – Data and Statistics (https://www.health.ny.gov/statistics/): This resource offers health-related datasets that illustrate dataset characteristics and variables. Participants can define datasets, discuss their characteristics, and explore variables, including independent and dependent variables. Participants can also examine health outcome data to identify variables such as patient demographics, treatment methods, and health outcomes.

NYC Crime Map (https://maps.nyc.gov/crime/): This resource offers crime data for New York City, allowing participants to distinguish between qualitative and quantitative aspects of data. They can explore examples of both types of data within crime statistics, such as qualitative descriptions of crime incidents and quantitative data on crime rates, locations, and trends.

NYC Environment and Health Data Portal (https://a816-dohbesp.nyc.gov/IndicatorPublic/data-explorer/): This resource offers environmental datasets for New York City, providing examples for discussing the choice between qualitative and quantitative approaches in data analysis. Participants can explore environmental data to classify examples into qualitative and quantitative categories and discuss when each approach is appropriate in different scenarios, such as assessing air quality or water pollution levels.

Join us for an insightful exploration & discussion of the Cure Violence program! During this session, attendees will gain insights into the CURE Violence program and listen to discussions on program evaluation, data utilization, and recommendations. This event is for policymakers, community leaders, researchers, and anyone passionate about fostering safer, healthier communities.

Cure Violence uses a public health approach to reduce gun violence. It aims to prevent conflicts from escalating, support individuals at high risk of violence, and shift social norms. You will briefly hear more about Cure and its history, and the results of our analysis of its effectiveness. This will set the stage for a panel discussion featuring stakeholders invested in building safer communities in NYC.

Panelists include Jeffrey A. Butts, Director of the Research and Evaluation Center at John Jay College of Criminal Justice, Council members Althea Stevens and Yusef Salaam, Chairs of the Committee on Children and Youth and Public Safety respectively, R. Brent Decker, Chief Program Officer of Cure Violence Global, and Hector Cuevas, Vice President of Education & Youth Development programs at CAMBA and moderated by Rose Martinez, Assistant Deputy Director of the NYC Council’s Data Team.

Come hear the graduate students of the School of Global Public Health present their research into the public health issues that affect the city we live in, New York City. The event will be hosted by Dr. Alex Dahlen of the Biostatistical Consultation and Collaboration Core (BCCC). RSVP here!

Talks will include:

  • Zoe Lindenfeld: “Publicly Available Community Data to Address Social Determinants of Health in New York City: A Compendium of Data Sources”
  • Jianan (Zoe) Zhu: “Simulation of New York City’s Ventilator Allocation Guideline During the Spring 2020 COVID-19 Surge”
  • Zoé Haskell-Craig: “Exploring Street Tree Care: a preliminary look at how different models of volunteer-based tree care can improve or exacerbate disparities in urban greenspace”
  • Yucheng Wang: “Neighborhood walkability and obesity”
  • Olivia Chien: “Urbanicity, neighborhood deprivation, and self-perceived financial stress”
  • And more!

RSVP here

Measure of America, a program of the Social Science Research Council (SSRC), is in the process of revamping DATA2GO.NYC, a free, easy-to-use online mapping and data tool that brings together federal, state, and city data on a broad range of issues critical to the well-being of all New Yorkers. The revamp will include updated data in addition to a redesign to ensure DATA2GO’s continued usefulness to people and organizations requiring easily accessible and understandable data on well-being, equity, needs, and resources to address those needs in NYC.

We are interested in the civic community’s input into this redesign and would love to hear your thoughts to help us help you measure what matters for community well-being. The event will begin with a description of the project roadmap and proceed to breakout rooms, polls, and other sharing opportunities to ensure that all attendees have a voice in contributing their thoughts and ideas to the DATA2GO redesign. Attendees will be acknowledged on the DATA2GO site in appreciation of their time. We hope to see you there!

This redesign effort is informed by a diverse advisory panel and is supported by the Leona M. and Harry B. Helmsley Charitable Trust, the original funders of DATA2GO.NYC.

The health data resources on the New York City Health Department website can help you incorporate data into research, planning, or evaluation. Learn how to access and use Health Department data from the experts who work on these public-facing data resources!

All you need is a computer with internet browsing capability.

In this session, we will cover the Community Health Profiles, EpiQuery, the Environment and Health Data Portal, COVID data, and NYC Open Data resources from the Health Department.

Interested in researching your family’s history in New York City? Join Ken Cobb, Assistant Commissioner of the NYC Department of Records and Information Services (DORIS) and Marcia Kirk, Archives and Research Associate, as you discover the rich NYC data that will help you in your research journey. They will review the archives’ Historical Vital Records collection with over 10 million digitized records and illustrate how to use the collection from home. You will also learn why these collections are so important to research and useful tips you can use in your research.

Furthermore, this year, the session will be held at the magnificent Surrogate’s Court building located in lower Manhattan at 31 Chambers Street. If you have not been here before, don’t miss the opportunity to see this impressive landmarked historic building. As soon as you enter, you will be mesmerized by the granite façade, marble interiors, and the beautiful mosaic tile ceiling.

We have limited seating, RSVP required!

New York City agencies create and publish a huge volume of geospatial data each year. We use geographic information systems (GIS), computer-based tools to store, visualize, and analyze this geographic data. This panel will review publicly available tools and data sets, discuss the state of GIS technology in the city, and consider how the City uses geospatial data to serve NYC residents. Join this conversation with agency GIS leaders about new maps & tools, geospatial data, and initiatives for 2024.

Panelists:

  • Lee Ilan, Mayor’s Office of Environmental Remediation (moderator)
  • Matt Croswell, NYC Department of City Planning
  • Josh Friedman, NYC Emergency Management
  • Chris Gettings, NYC Department of Health & Mental Hygiene
  • Carlos Piedad, Mayor’s Office of Climate & Environmental Justice

The Mayor’s Office of Climate & Environmental Justice (MOCEJ) will introduce and provide a live demonstration of the soon-to-be-released Environmental Justice NYC (EJNYC) Mapping Tool.

This exciting new tool allows users to view and interact with a wide variety of data layers to better understand the distribution of environmental burdens and benefits across the city on a neighborhood-by-neighborhood level. Over 100 datasets related to environmental justice concerns have been compiled and processed into a single platform, providing access to information and data that can help community-based organizations and residents advocate for the best outcomes in their communities.

MOCEJ staff will also give an overview of the City’s first-ever Flood Vulnerability Index (FVI), which is making its debut in the EJNYC Mapping Tool. Similar to the City’s Heat Vulnerability Index (HVI), the FVI quantifies and maps vulnerability to flood hazards. The FVI reflects each of the three components of vulnerability: exposure to a hazard, harm from the exposure, and capacity to recover (Cutter et al 2009). It demonstrates how these dimensions of vulnerability are distributed across areas that have different social, political, and economic capacities to guide policies and programs to address vulnerability to multiple sources of flooding in the city.

This event is open to all, no prior expertise is required! The EJNYC Mapping Tool is meant to be a useful and accessible resource for all. If you are interested in environmental justice, climate justice, pollution reduction, or public health, we encourage you to attend!

Rats in NYC are widespread, as they are in many densely populated areas. As of October 2023, NYC dropped from the 2nd to the 3rd place in the annual “rattiest city” list released by a pest control company.

Join Dr. Jun Yan and data science students from the University of Connecticut for presentations that delve into the presence of rats in the city, including a detailed analysis of city-wide rat sighting and rodent inspection data from the City’s Health Department. The student’s work includes descriptive statistics and visualizations of rat sightings across the city. The maps will be further analyzed to uncover correlations between rat sightings and various factors, including sociodemographic profiles, housing characteristics, and the physical landscape of the city. Additionally, we will share our investigation into the broader impact of rat sightings on other civic functions within NYC, like restaurant inspections, by integrating other NYC Open Data sources.

This engaging and informative workshop will be conducted by a selected group of students from the University of Connecticut, enrolled in the Introduction to Data Science course. These students have completed this work as part of their midterm assignment. They will show the results from their analyses as well as the Python code that generated the analyses. The workshop is open to anyone who is interested in urban challenges or data science.