Presenters ⭐️

Kiley Matschke (Post-Baccalaureate Fellow at Barnard College’s CSC),

Marko Krkeljas (Senior Software & Applications Developer and CSC Technical Manager at Barnard College)

Event details 📊

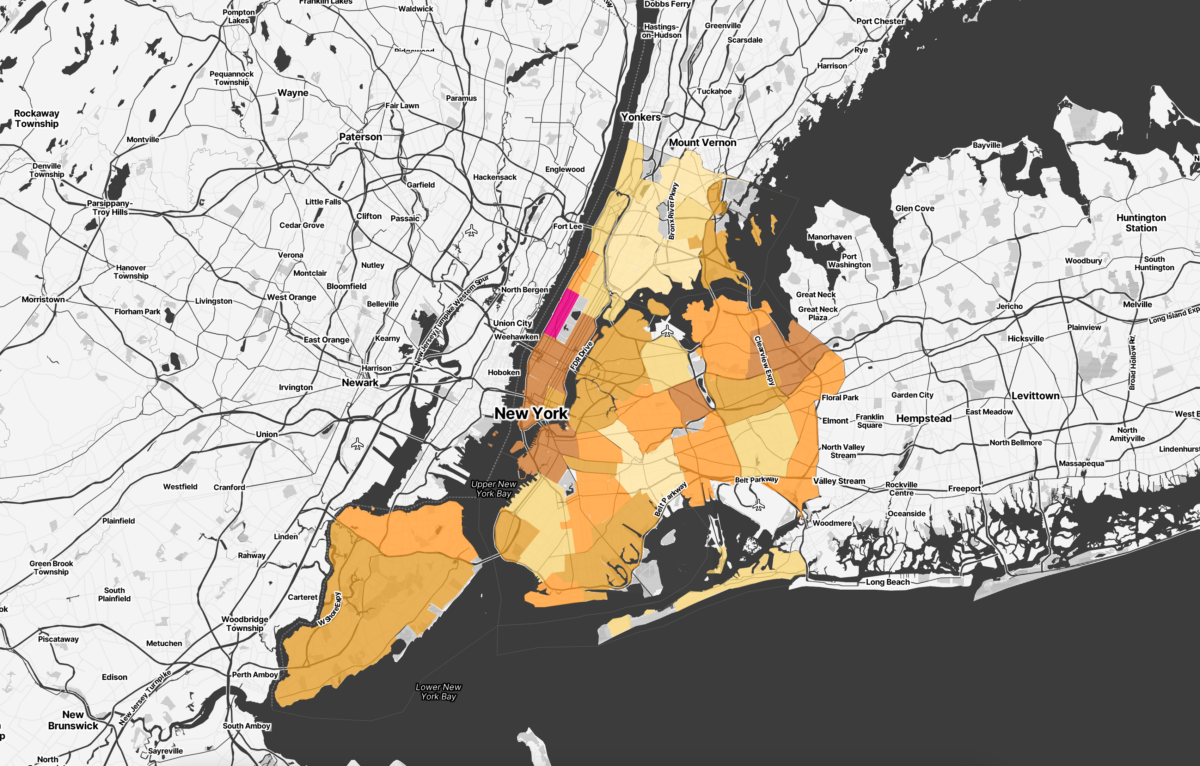
Join us in celebrating NYC Open Data Week at Barnard College’s Vagelos Computational Science Center (CSC)! This two-part workshop and data jam will explore data analysis and visualization utilizing NYC environmental data. In the first half of this workshop, participants will explore ChatGPT’s data capabilities and contrast them with their own analyses via Google Co-lab. In the second half, participants will work in small groups to ideate and produce creative, accessible projects that showcase their data findings (i.e., in the form of collages, songs, stories, etc.). This workshop will explore the importance of data presentations and their impact on viewer perceptions. Those from all backgrounds and coding levels are welcome, beginner-friendly. Register here!

Location 📍

This will be a hybrid event!

Important note: Attendees who are not affiliated with Barnard College or Columbia University are strongly encouraged to attend this event via Zoom. This is due to increasingly strict/fluctuating policies surrounding campus access for the general public.

In-person location: Barnard College, Milstein Center Room 516 (5th Floor); 3009 Broadway, New York, NY 10027

Online location: Zoom (Register here to receive the link, which will be emailed in advance of the event)

The Bronx River Alliance uses, collects, and analyzes data from countless sources to advocate for and improve the condition of the Bronx River and the communities that surround it. Join us to see how data has brought an urban river corridor back to life, and discuss ways in which environmental data accessibility can be improved to further environmental restoration and protection goals across the city and beyond.

We’ll kick off the event with a short presentation about the Bronx River Alliance – including the work we do and the challenges we face in collecting, organizing, and sharing data. Afterwards, we will open the floor for a collaborative brainstorming discussion about community data collection, especially around water quality and the overall environment of New York City, and have some time for attendees to chat with each other.

The last hour of the event will consist of an optional walking tour (handicap accessible) of Starlight Park and the Bronx River House

If you have shareable ecological data – whether you collect water samples, are an avid recorder of bird migrations, or work in a laboratory for soil analysis – please come prepared to discuss or even bring a sample!

Email christian.murphy[at]bronxriver.org with any questions.

Is the New York City Public Schools the most segregated school district in the nation, as is often claimed? What county has the most segregated schools in the United States? By how much has segregation changed after recent school integration initiatives? IntegrateUSA is a new website — launching at the NYC Open Data Week 2024 — designed to answer these and other questions. Incorporating over two decades of publicly-available school enrollment data from the National Center for Education Statistics’ Common Core of Data, IntegrateUSA can be used to easily visualize student demographics and track school segregation in all states, counties, and districts in the United States.

At this event, we (Jesse Margolis and Theo Kaufman) will discuss the motivation for IntegrateUSA’s development, demonstrate its use, and talk about the process for building it. We will outline the three key steps in our process: 1) data cleaning and calculation (using R), 2) backend database hosting (using Django and PostgreSQL) on an AWS server and 3) frontend deployment using Next.js and React. We will compare the development of this national tool with its predecessor, IntegrateNY — deployed in Tableau Public — and discuss the pros and cons of each approach.

We hope this event will be of interest to researchers, policy makers, and reporters studying school segregation as well as analysts and programmers who build tools to better visualize publicly-available data. As an initial beta release, IntegrateUSA has much room for improvement and we hope our audience will suggest both what to improve and how to make these improvements. We are grateful to the Carnegie Corporation of New York for supporting the development of IntegrateUSA.

Interested in how NYC can better collect demographic data by ethnicity? Join us at “Why Everyone Wins When NYC Embraces Disaggregated Data” on Monday, March 18 10:30am-12:00pm where the Coalition for Asian American Children and Families (CACF) will present on the critical importance of disaggregating demographic data by ethnicity for Asian communities in NYC and convene an engaging discussion for diverse stakeholders across communities, agencies, elected officials among others to brainstorm how we can collaborate together on making disaggregated ethnicity data a reality for NYC. RSVP here.

For over a decade, CACF has led the Invisible No More Campaign, fighting for disaggregated data, steering a coalition of diverse partners across communities and industries that successfully garnered the NYC’s 2016 demographic data laws and NYS’s first-ever Asian American and Native Hawaiian Pacific Islander data disaggregation law in 2021. CACF is focused on ensuring that implementation of ethnicity-based data disaggregation leads to the data representation that all communities urgently need and deserve.

This event will be in-person and 1.5 hours in duration. CACF’s Invisible No More team will present an overview of its longstanding advocacy for ethnicity-based data disaggregation and share an analysis of a recent Department of Education dataset on class size and demographics by middle school and high school. Then there will be a discussion between attendees about how we can work together toward agency-level ethnicity-based data disaggregation and a shareback. The final portion of the in-person event will be a networking session for attendees to meet one another.

RSVP at bit.ly/CACFOpenDataWeek

The free, open-source python library, “nycschools”, makes it easier to work with and analyze open data regarding New York City Public Schools, including geospatial data. In this workshop the team behind the library, from Adelphi University’s MIXI Institute, shares their recent work creating maps that help understand school data in the context of the US Census. After presenting a series of maps and data visualizations we will offer a brief python tutorial to help participants make their own maps with school and/or census data.

No technical experience is necessary to attend, but there will be the opportunity to write some code and get started programming in an online environment.

Measure of America, a program of the Social Science Research Council (SSRC), is in the process of revamping DATA2GO.NYC, a free, easy-to-use online mapping and data tool that brings together federal, state, and city data on a broad range of issues critical to the well-being of all New Yorkers. The revamp will include updated data in addition to a redesign to ensure DATA2GO’s continued usefulness to people and organizations requiring easily accessible and understandable data on well-being, equity, needs, and resources to address those needs in NYC.

We are interested in the civic community’s input into this redesign and would love to hear your thoughts to help us help you measure what matters for community well-being. The event will begin with a description of the project roadmap and proceed to breakout rooms, polls, and other sharing opportunities to ensure that all attendees have a voice in contributing their thoughts and ideas to the DATA2GO redesign. Attendees will be acknowledged on the DATA2GO site in appreciation of their time. We hope to see you there!

This redesign effort is informed by a diverse advisory panel and is supported by the Leona M. and Harry B. Helmsley Charitable Trust, the original funders of DATA2GO.NYC.

The WeGovNYC Databook is a set of software and data tools that index, normalize, and republish over 40 NYC Open Data datasets into a single interface. We produce this tool to give New Yorkers a better understanding of how our city works.

During this session, we’ll review how the Databook’s data pipeline works, how we prototype and build out our interface, and tour you through the recently upgraded Capital Projects directory and the new NYC Schools and School District section.

The Databook’s most popular interface is the Capital Project Directory, which combines four city open datasets to generate a profile page for every capital project in NYC. These pages compare a project’s original planned budget and work timeline to its current one, revealing if projects are over budget or late.

Our latest addition to the Databook is a section on NYC Schools and School Districts. This section combines over a dozen datasets from the Department of Education, Department of Health, and School Construction Authority to give you a uniquely detailed view of our city’s public schools.

We want to make this tool as useful as possible to you, so we’d love to hear your thoughts, ideas and feedback and more.

Some questions that will be explored during this session:

  • How can we use open data to make the City’s capital budgeting process more understandable?
  • How can we help you track capital projects that you care about?
  • What should we do, with whom should we partner, and how can we make NYC better using all of the City’s fantastic open data!?

Interested in researching your family’s history in New York City? Join Ken Cobb, Assistant Commissioner of the NYC Department of Records and Information Services (DORIS) and Marcia Kirk, Archives and Research Associate, as you discover the rich NYC data that will help you in your research journey. They will review the archives’ Historical Vital Records collection with over 10 million digitized records and illustrate how to use the collection from home. You will also learn why these collections are so important to research and useful tips you can use in your research.

Furthermore, this year, the session will be held at the magnificent Surrogate’s Court building located in lower Manhattan at 31 Chambers Street. If you have not been here before, don’t miss the opportunity to see this impressive landmarked historic building. As soon as you enter, you will be mesmerized by the granite façade, marble interiors, and the beautiful mosaic tile ceiling.

We have limited seating, RSVP required!

This workshop aims to provide practical tools and examples for integrating Open Data, including NYC Open Data into undergraduate and graduate classes, especially those of architecture and design education.

Attendees will receive an overview of three studio activities designed by educators at the New York Institute of Technology to help develop workshops or lesson plans that introduce students to accessing and interpreting data-driven narratives. The presentations cover relevant data visualization history; the definition of open data, and examining the environmental, climatic, and City agency data sources to generate maps, graphs, and diagrams as the basis for community-responsive narratives and analysis, often used in architecture and city planning. Attendees will also learn the workflow for harnessing openly available climate data where students can map sun and weather patterns.

The ideal attendee is an instructor who will leave with tools they can adapt for their classroom.

Join David Tussey, formerly of the NYC Department of Information Technology and Telecommunications, and Dr. Jan Yun, a professor at UConn for a presentation that explores data cleansing, a necessary first step in any data science or analysis effort.

During the event we will explore six areas of data cleanliness: structural issues, missing/blank data, validating data types, identifying invalid values, identifying logical inconsistencies, and identifying redundant data elements. We’ll use 311 service request data from 2022-2023 that was analyzed using custom software written in R. Even with only two calendar years, this is still  approximately 6.4 million records!

Our goal is for attendees to come away with an understanding of real-world data cleanliness issues and some approaches to account for them.

This presentation is targeted to any analyst engaged in data science efforts. It is intended to be illustrative of the kinds of challenges faced by data scientists when analyzing large datasets. After there presentation there ample opportunity for Q&A.