Join Loisaida for a presentation on soil health and tree-bed conditions, followed by a field exercise examining and mapping the state of nearby street tree environments. Learn about common tree care issues, along with actions that New Yorkers and community groups can take to improve publicly available data. Our goal is to foster stewardship while maintaining and expanding the urban forest in the Loisaida neighborhood.

This event is part of Loisaida’s ECOLIBRIUM program, learn more at ecolibrium.nyc.

Join us for a 45 minute walk through Downtown Brooklyn to uncover New York City’s open datasets, smart cities infrastructure and other urban gems hidden in plain sight. Our objective is to explore an unseen part of New York City – this walking tour is led by Helpful Places in partnership with inCitu, Data Through Design and Numina. After the  walk we’ll settle into a nearby coffeeshop to discuss what we saw (and warm up!).

Uncover the unseen parts of Manhattan’s East Village through a 45-minute walking tour led by Helpful Places in partnership with Sarah Batchu, a nonprofit leader and public servant. Together, we will explore open datasets, smart cities infrastructure, and other urban gems hidden in plain sight.

After the 45-minute walk we’ll settle into a nearby coffeeshop to discuss what we saw (and warm up!). Details on the exact meetup location will be sent to those who RSVP a few days prior to the event.

Helpful Places is a social enterprise responsible for stewarding Digital Trust for Places and Routines (DTPR), an open source design system and data standard bringing transparency to technologies and data-collecting practices in public spaces.

Sarah Batchu is a nonprofit leader and public servant who is dedicated to building a city where every New Yorker can access the data that powers our city.

The Bronx River Alliance uses, collects, and analyzes data from countless sources to advocate for and improve the condition of the Bronx River and the communities that surround it. Join us to see how data has brought an urban river corridor back to life, and discuss ways in which environmental data accessibility can be improved to further environmental restoration and protection goals across the city and beyond.

We’ll kick off the event with a short presentation about the Bronx River Alliance – including the work we do and the challenges we face in collecting, organizing, and sharing data. Afterwards, we will open the floor for a collaborative brainstorming discussion about community data collection, especially around water quality and the overall environment of New York City, and have some time for attendees to chat with each other.

The last hour of the event will consist of an optional walking tour (handicap accessible) of Starlight Park and the Bronx River House

If you have shareable ecological data – whether you collect water samples, are an avid recorder of bird migrations, or work in a laboratory for soil analysis – please come prepared to discuss or even bring a sample!

Email christian.murphy[at]bronxriver.org with any questions.

Are you interested in enriching your reports and manuscripts with interactive content? Join Donnise Hurley from the NYC Department of City Planning to gain a basic knowledge of how to create dynamic, reproducible documents in R. Participants will receive an introduction to Markdown basics; using YAML metadata and CSS to control how files are rendered; simple syntax for adding interactive content such as maps; formatting text; and adding quotes, footnotes, and references.

To attend this event, you must register for it HERE.

The operation of buildings causes nearly 70% of total greenhouse gas (GHG) emissions in NYC. In recent years, the city government has made measuring and regulating these emissions from buildings a central plank of its climate policy – and has become a model for cities across the country to follow.

This talk from Two Sigma Data Clinic will delve into rich sources of publicly available data to help you understand the nuances of energy use and efficiency in NYC’s residential buildings. Topics include the sources of building emissions, the factors that make some buildings more GHG intensive than others, and how efficiency is defined can have unexpected implications.

Who should attend?
·    NYC buildings enthusiasts
·    Sustainability advocates
·    Community organizations
·    NYC officials or staff
·    Open data users
·    Civic tech lovers
·    Anyone!

Virtual accommodations: Virtual Google Meet allows for live captioning. Please contact us at dataclinic@twosigma.com for any other accommodation needs.

In-person accommodations: Step-free access to the venue. Please contact us at dataclinic@twosigma.com for any other accommodation needs.

The free, open-source python library, “nycschools”, makes it easier to work with and analyze open data regarding New York City Public Schools, including geospatial data. In this workshop the team behind the library, from Adelphi University’s MIXI Institute, shares their recent work creating maps that help understand school data in the context of the US Census. After presenting a series of maps and data visualizations we will offer a brief python tutorial to help participants make their own maps with school and/or census data.

No technical experience is necessary to attend, but there will be the opportunity to write some code and get started programming in an online environment.

Help us create open data about communities! North Brooklyn Parks Alliance (NBPA), Senator Kristen Gonzalez, Assembly Member Emily Gallagher, City Council Member Jen Gutiérrez, City Council Member Lincoln Restler, and BetaNYC invite you to map McCarren Park and learn about our Mapping for Equity project.

Join our team at the Greenpoint Library and learn how to turn the data collected at our [field mapping event](hyperlink to event page) into publically accessible open data on OpenStreetMap. Our staff and Civic Innovation Fellows will guide you through the process of uploading and tagging features on OpenStreetMap. All are welcome to share their skills or learn for the first time!

No experience is required to attend. Please bring your own laptop, charger, mouse, and a high-quality mask. If you don’t have a mask, we’ll have one for you. This event will be delivered in English and all ages are welcome, provided that anyone under 18 years old is present with a parent or guardian. The Greepoint Library is wheelchair accessible. If you have any needs or accommodations, please email events@beta.nyc.

This event is part of a series of Mapping for Equity events led by BetaNYC fellow. You do not need to attend both events to participate. Join us for one or both!

  • March 16, 10:00 am – 12:00 pm @ McCarren Park Fieldhouse
  • March 20, 3:30pm – 5:30 pm @ Greenpoint Library

About Mapping for Equity: BetaNYC Fellows are making sure there is equal representation in data while quantifying and mapping our public realm. Together, we will represent community assets to better steward our neighborhoods.

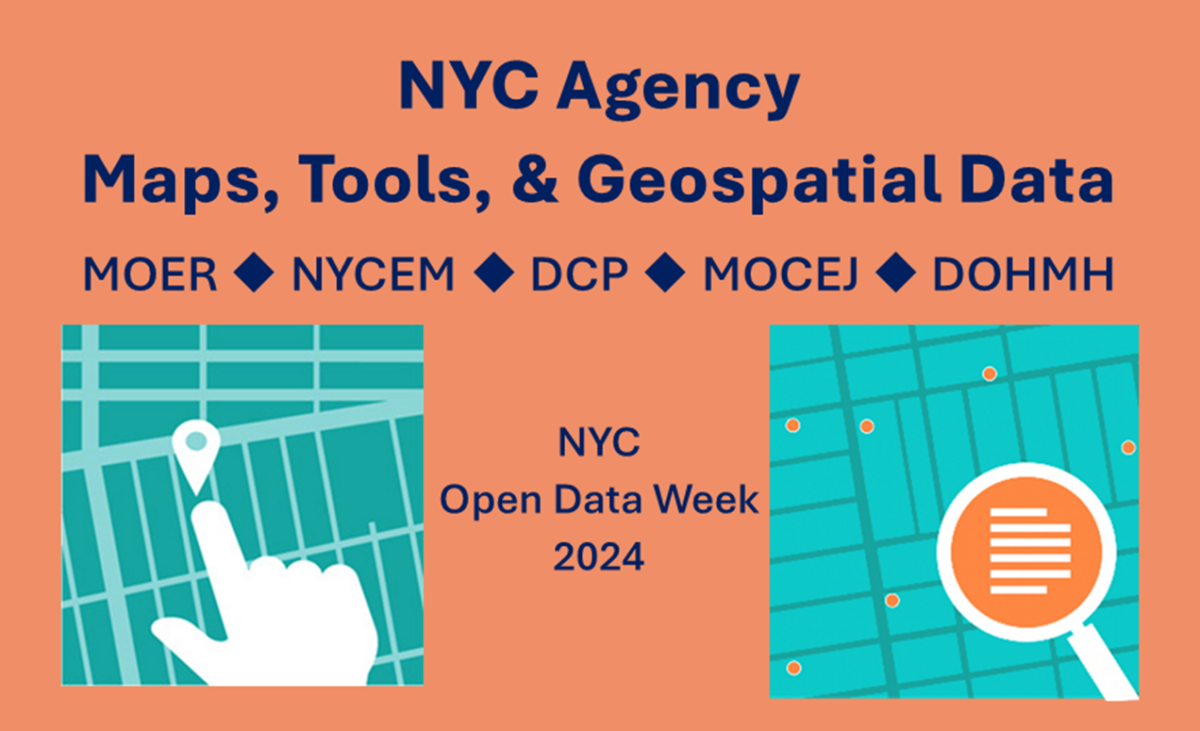
New York City agencies create and publish a huge volume of geospatial data each year. We use geographic information systems (GIS), computer-based tools to store, visualize, and analyze this geographic data. This panel will review publicly available tools and data sets, discuss the state of GIS technology in the city, and consider how the City uses geospatial data to serve NYC residents. Join this conversation with agency GIS leaders about new maps & tools, geospatial data, and initiatives for 2024.

Panelists:

  • Lee Ilan, Mayor’s Office of Environmental Remediation (moderator)
  • Matt Croswell, NYC Department of City Planning
  • Josh Friedman, NYC Emergency Management
  • Chris Gettings, NYC Department of Health & Mental Hygiene
  • Carlos Piedad, Mayor’s Office of Climate & Environmental Justice

Rats in NYC are widespread, as they are in many densely populated areas. As of October 2023, NYC dropped from the 2nd to the 3rd place in the annual “rattiest city” list released by a pest control company.

Join Dr. Jun Yan and data science students from the University of Connecticut for presentations that delve into the presence of rats in the city, including a detailed analysis of city-wide rat sighting and rodent inspection data from the City’s Health Department. The student’s work includes descriptive statistics and visualizations of rat sightings across the city. The maps will be further analyzed to uncover correlations between rat sightings and various factors, including sociodemographic profiles, housing characteristics, and the physical landscape of the city. Additionally, we will share our investigation into the broader impact of rat sightings on other civic functions within NYC, like restaurant inspections, by integrating other NYC Open Data sources.

This engaging and informative workshop will be conducted by a selected group of students from the University of Connecticut, enrolled in the Introduction to Data Science course. These students have completed this work as part of their midterm assignment. They will show the results from their analyses as well as the Python code that generated the analyses. The workshop is open to anyone who is interested in urban challenges or data science.