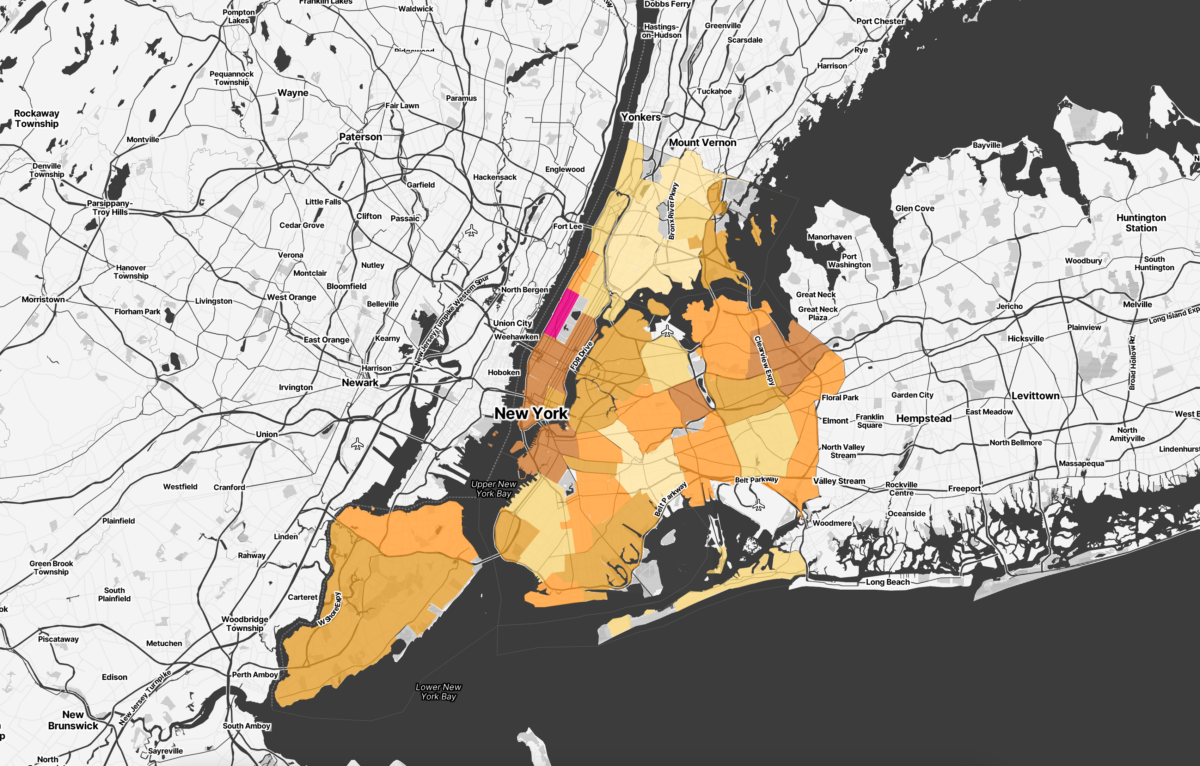
Measure of America, a program of the Social Science Research Council (SSRC), is in the process of revamping DATA2GO.NYC, a free, easy-to-use online mapping and data tool that brings together federal, state, and city data on a broad range of issues critical to the well-being of all New Yorkers. The revamp will include updated data in addition to a redesign to ensure DATA2GO’s continued usefulness to people and organizations requiring easily accessible and understandable data on well-being, equity, needs, and resources to address those needs in NYC.

We are interested in the civic community’s input into this redesign and would love to hear your thoughts to help us help you measure what matters for community well-being. The event will begin with a description of the project roadmap and proceed to breakout rooms, polls, and other sharing opportunities to ensure that all attendees have a voice in contributing their thoughts and ideas to the DATA2GO redesign. Attendees will be acknowledged on the DATA2GO site in appreciation of their time. We hope to see you there!

This redesign effort is informed by a diverse advisory panel and is supported by the Leona M. and Harry B. Helmsley Charitable Trust, the original funders of DATA2GO.NYC.

The health data resources on the New York City Health Department website can help you incorporate data into research, planning, or evaluation. Learn how to access and use Health Department data from the experts who work on these public-facing data resources!

All you need is a computer with internet browsing capability.

In this session, we will cover the Community Health Profiles, EpiQuery, the Environment and Health Data Portal, COVID data, and NYC Open Data resources from the Health Department.

New York City agencies create and publish a huge volume of geospatial data each year. We use geographic information systems (GIS), computer-based tools to store, visualize, and analyze this geographic data. This panel will review publicly available tools and data sets, discuss the state of GIS technology in the city, and consider how the City uses geospatial data to serve NYC residents. Join this conversation with agency GIS leaders about new maps & tools, geospatial data, and initiatives for 2024.

Panelists:

  • Lee Ilan, Mayor’s Office of Environmental Remediation (moderator)
  • Matt Croswell, NYC Department of City Planning
  • Josh Friedman, NYC Emergency Management
  • Chris Gettings, NYC Department of Health & Mental Hygiene
  • Carlos Piedad, Mayor’s Office of Climate & Environmental Justice

Join this training with the NYC Comptroller’s Office to learn about data the NYC Climate Dashboard including the data it contains and how to use this data in community and advocacy work.

The dashboard is a one-stop-shop webpage for all things climate and environmental information in NYC. It aims to help New Yorkers hold the City accountable to its climate goals to mitigate the threats of climate crisis, advance a just transition to renewable energy and a green economy, and build a city that’s more resilient in the face of rising seas and temperatures.

The dashboard takes public information, mostly from NYC Open Data, and presents it in ways that are readily digestible and usable for the general public.

The Mayor’s Office of Climate & Environmental Justice (MOCEJ) will introduce and provide a live demonstration of the soon-to-be-released Environmental Justice NYC (EJNYC) Mapping Tool.

This exciting new tool allows users to view and interact with a wide variety of data layers to better understand the distribution of environmental burdens and benefits across the city on a neighborhood-by-neighborhood level. Over 100 datasets related to environmental justice concerns have been compiled and processed into a single platform, providing access to information and data that can help community-based organizations and residents advocate for the best outcomes in their communities.

MOCEJ staff will also give an overview of the City’s first-ever Flood Vulnerability Index (FVI), which is making its debut in the EJNYC Mapping Tool. Similar to the City’s Heat Vulnerability Index (HVI), the FVI quantifies and maps vulnerability to flood hazards. The FVI reflects each of the three components of vulnerability: exposure to a hazard, harm from the exposure, and capacity to recover (Cutter et al 2009). It demonstrates how these dimensions of vulnerability are distributed across areas that have different social, political, and economic capacities to guide policies and programs to address vulnerability to multiple sources of flooding in the city.

This event is open to all, no prior expertise is required! The EJNYC Mapping Tool is meant to be a useful and accessible resource for all. If you are interested in environmental justice, climate justice, pollution reduction, or public health, we encourage you to attend!

Rats in NYC are widespread, as they are in many densely populated areas. As of October 2023, NYC dropped from the 2nd to the 3rd place in the annual “rattiest city” list released by a pest control company.

Join Dr. Jun Yan and data science students from the University of Connecticut for presentations that delve into the presence of rats in the city, including a detailed analysis of city-wide rat sighting and rodent inspection data from the City’s Health Department. The student’s work includes descriptive statistics and visualizations of rat sightings across the city. The maps will be further analyzed to uncover correlations between rat sightings and various factors, including sociodemographic profiles, housing characteristics, and the physical landscape of the city. Additionally, we will share our investigation into the broader impact of rat sightings on other civic functions within NYC, like restaurant inspections, by integrating other NYC Open Data sources.

This engaging and informative workshop will be conducted by a selected group of students from the University of Connecticut, enrolled in the Introduction to Data Science course. These students have completed this work as part of their midterm assignment. They will show the results from their analyses as well as the Python code that generated the analyses. The workshop is open to anyone who is interested in urban challenges or data science.

Learn how Heat Storyan interactive tool that maps the inequitable impacts of extreme heat—was built using open source tools and brought to life via community science and stories, in collaboration with South Bronx Unite.

When New Yorkers’ own stories about how heat has affected their neighborhoods, commutes, and homes are overlaid onto a map rich with open datasets exploring racist housing policies, income inequality, heat-related illness, and more, the impact of the compounding inequities that influence the effects of heat is made both personal and global for cities everywhere.

The process of translating this tool into a government data feature involved monthly meetings between the NYC Health Department (Emily Torem, Matthew Montesano, and Chris Gettings); principal investigator Dr. Liv Yoon; and software engineer Thomas Zinckgraf, to discuss the visual direction and user interaction; and then an iterative process of pushing changes through a Github repository, testing them out, and making further changes as a team. Through sharing this process with you, we hope to illuminate some of the mechanics of open data projects between different stakeholders to help advance equity in the environment, health, and climate spaces.

Join this presentation to hear from the team behind Heat Story as they:

  • Talk through building an interactive climate data feature using open source tools and a hands-on approach
  • Share techniques for community engagement around climate topics like heat-related illness and inequities
  • Explain how you or someone you know can share your story with this living project and help humanize the impacts of heat in NYC
  • Discuss why and how mapping climate and health indicators like air quality, neighborhood poverty, heat stress hospitalizations, heat vulnerability, AC access, and more is such a powerful tool for climate justice communication and advocacy
  • Answer any questions you may have about starting related projects

Urban populations are aging, and climate change puts older adults at increasing risk from extreme heat. Yet current approaches to understanding and intervening to reduce risk, harm, and cost are imprecise and fragmented. To meet emerging healthcare needs we must understand the individual and local factors that determine how much heat people experience (exposure), how their bodies respond (sensitivity), and timely actions to intervene (adaptive capacity).

Join this workshop to

  • receive an overview of a new applied research Initiative on Aging and Adaptation to Extreme Heat, linking all three Cornell campuses in New York City (Cornell Tech, Weill-Cornell Medicine) and the main Ithaca, NY campus.
  • learn about a new, curated collection of open city, state, and federal data focused on this topic (the Extreme Heat and Aging Exchange)
  • discuss our plans to evolve this catalog into a data and model collaborative providing a forum for stakeholders to share knowledge, and ways to get involved.

EquityNYC, a project of the Mayor’s Office for Economic Opportunity, reports the status of racial and social equity in New York City and the City’s work to address disparities. The site visualizes and contextualizes over 225 disaggregated metrics that measure population-level well-being, who the City serves, where services are located, who the City employs, who receives City contracts, and how the City promotes equity internally.

Join us to learn more about EquityNYC, understand the technology behind the site, discover how to use equity data in decision-making, and suggest potential use-cases to explore. To learn more, visit https://equity.nyc.gov/

Close out Open Data Week with BetaNYC!

When: Saturday, March 23 from 9am to 6pm
Where: CUNY School of Law
Website: schoolofdata.nyc
Registration: nycsodata2024.eventbrite.com

Join us for our annual community-driven public interest technology conference. Participants come to learn, network, and collaborate around public interest technology, data, and design in New York City. With programming support from the Open Data Team at the NYC Office of Technology and Innovation, our conference convenes city officials, technologists, designers, data analysts, and community members around open data, civic technology, and service design in New York City.

This year, we are commemorating the 14th anniversary of International Open Data Day, the 12th anniversary of the City’s transformative Open Data Law, and the conclusion of NYC Open Data Week.

There will be panels, workshops, demos, talks, presentations, and sessions with NYC agencies, on a range of civic topics. Whether you’re new to the community or well-acquainted, you’re invited to spend the day with us learning, sharing, discovering, and connecting around a shared passion to build a better civic society for ALL New Yorkers.

NYC School of Data is organized by BetaNYC, with programming support from the NYC Office of Data Analytics and hosted by CUNY School of Law.


Tickets include breakfast, lunch, coffee/beverages, an accessible venue, and childcare for those who need it. Thank you for helping us cover the costs of producing a large community event. Interested in volunteering?  Interested in a scholarship ticket? Need childcare? Work for Government? Read on…

Scholarships: There are a select number of scholarship tickets available. Tickets are $35, and we will prioritize traditionally underserved and underrepresented communities. Learn more and apply before Wednesday, 20 March, at 5:00 PM.

Volunteering: The official deadline has passed, but you can still apply to volunteer at School of Data. We are reviewing applications in the order we receive them and will consider late ones on a case-by-case basis.

Childcare: This year, we have contracted Smart Sitting for on-site childcare for children under the age of 18. To use this service, you MUST be a ticket-holder, and you MUST register your child before March 21 by acquiring a Childcare Ticket on Eventbrite. Each child you register requires a ticket registration. There are limited spots available, so please sign up sooner rather than later!

Government Tickets: If you work for government and want to purchase $55 tickets via a check or a purchase order (PO), the opportunity closes on Wednesday, 20 March, at 5:00 PM. Please email < schoolofdata+govticket@beta.nyc >.

Important! To attend this event, you must register at nycsodata2024.eventbrite.com